Model support files have been created for the Dobson, FTIR, Lidar, and Sonde working groups based on their stations’ locations, the temporal frequency of sampling, and the atmospheric species (constituents) each instrument type measures. There are two types of content, one customized for the FTIR group and the other for the Lidar, Dobson, and Sonde working groups. File content is based on each group’s request for constituent and meteorological fields. The support files were created from a Hindcast simulation produced by the NASA Global Modeling Initiative (GMI) chemistry transport model integrated with MERRA2 (reanalysis) meteorology. Individual station data files, each containing 1 year of model output, are available for years 1985 to 2016. The files are written in netCDF format and can be found here: ftp://ftp.cpc.ncep.noaa.gov/ndacc/gmi_model_data/
The files written for the Lidar, Dobson, and Sonde stations contain hourly vertical profiles of O3, NO2, H2O, temperature, pressure, and potential vorticity on a geometric altitude coordinate with 1 km resolution. The FTIR station files consist of daily 12Z or monthly mean profile and column quantities for 15 atmospheric species, including O3, N2O, CH4, and HCl. Basic meteorological quantities are also included. The FTIR species are reported on 72 pressure levels between the surface and 0.01 hPa. Details of each file type’s content can be found in a ‘readme’ file in the model data subdirectory of the NDACC data archive.
The GMI Model
The support files were created from a Hindcast simulation of the NASA Global Modeling Initiative (GMI) chemistry transport model (CTM) integrated for 1980-2016. The simulation was integrated with NASA MERRA2 meteorology at 1ox1.25o lat x lon horizontal resolution with 72 hybrid sigma-pressure (‘eta’) levels spanning the surface to 0.01 hPa. We use time-dependent surface emissions for biomass burning, biofuels, and fossil fuels. For the stratosphere and upper troposphere we use time-dependent stratospheric sulfate aerosols from IGAC. Tropospheric aerosol fields come from the MERRA2 assimilation. The aerosol fields are used as inputs and do not interact with GMI chemistry. The GMI Model PI is Susan Strahan.
The GMI chemistry transport model integrated with MERRA or MERRA2 meteorology produces realistic simulations of the atmospheric composition of the recent past. The GMI output can be used to determine the effects of irregular temporal sampling at a station. When used in combination with the full, 3D GMI simulation, differences between station data and the zonal mean indicate the representativeness of a station. This is particularly relevant for the attribution and interpretation of long-term trends. GMI simulations build a bridge between the irregular space/time sampling of ground-based measurements and the global perspective.
Output from the GMI-MERRA2 simulation can be used to place individual instrument data records into a regional or global context. The full GMI-MERRA2 simulation output in netcdf file format is available via anonymous ftp to dirac.gsfc.nasa.gov. Change directory (cd) to /pub/gmidata2/users/mrdamon/Hindcast-Family/HindcastMR2/YYYY where YYYY ranges from 1980-2016. Details about this simulation can be found on the GMI web site: https://gmi.gsfc.nasa.gov/merra2hindcast/. Please contact Susan Strahan (susan strahan ∂does-not-exist.nasa gov) for guidance on file content and for IDL routines to read the netcdf files.
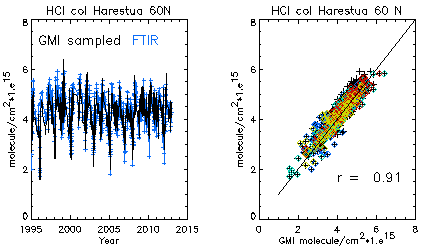
Left panel: The GMI-MERRA simulation captures the observed seasonal, interannual, and decadal variability column HCl measured at Harestua, Norway (60oN, 10oE).
Right panel: Scatterplot of the points in the left panel, demonstrating excellent agreement. Similar agreement is found at midlatitudes. The colors indicate different seasons.
GMI References
For general info on the model and its chemical mechanism, see B.N. Duncan et al. (2007), Model study of cross-tropopause transport of biomass burning pollution, Atmos. Chem. Phys., 7, 3713-3736.
For general model info and UT/LS transport evaluation (with GEOS4), see S.E. Strahan et al (2007), Observationally derived transport diagnostics for the lowermost stratosphere and their application to the GMI chemistry and transport model, Atmos. Chem. Phys., 7, 2435-2445.
For polar chemistry and transport evaluation (with MERRA), see S.E. Strahan et al., (2013), The contributions of chemistry and transport to low Arctic ozone in March 2011 derived from Aura MLS Observations, J. Geophys. Res., 118, doi:10.1002/jgrd.50181.
For a comparison of NDACC and simulated midlatitude composition, see Douglass et al. (2017), Multi-decadal records of stratospheric composition and their relationship to stratospheric circulation change, Atmos. Chem. Phys., 17, 12,081-12,096.
For details on the surface emissions, see S. A. Strode et al. (2015), Trends and variability in surface ozone over the United States, J. Geophys. Res., 120, doi:10.1002/2014JD022784.
For information on MERRA, see Rienecker, M.M. et al. (2011), MERRA: NASA’s Modern Era Retrospective Analysis for Research and Applications, J. Climate, 24, 3624-3648., 2011.
For information on MERRA2, see Gelaro, R., et al. (2017), The Modern-Era Retrospective Analysis for Research and Applications, Version 2 (MERRA-2). J. Climate, 0, doi: 10.1175/JCLI-D-16-0758.1.
